Internship 2010: Statistical Data Analysis Tool
Contents
Overview
Statistical models are widely used in analysis of different types of data currently.Statistical analysis of data acts a major role in decision making under uncertainty and it is widely used in surveys, research,business and science. Hence it is very useful to have a statistical data analysis tool in a data manipulating application like Calc. The main aspect of the statistical data analysis tool project is to provide the user ability of performing various statistical functions to analyze data in openoffice calc spreadsheets in a very user friendly manner.
Goals/Requirements
Successful completion of this project at the minimum would include:
- Openoffice calc extension for statistical data analysis
- Providing the ability for a user to do data analysis using various useful statistical methods in a very user friendly manner
The statistical data analysis tool contains the following analysis methods in the completion of the project
- Correlation analysis ---Done
- Covariance analysis---Done
- Rank and percentile analysis---Done
- T test---Done
- Paired t test for means
- t test assuming equal variances
- t test assuming unequal variances
- ANOVA test---Done
- One-way ANOVA
- Two-way ANOVA with replications
- Two-way ANOVA without replications
- F-test two-sample for variances---Done
- Z test- Two samples for means---Done
- Moving average analysis with charts---Done
- Histogram analysis with charts---Done
- Exponential smoothing---Done
- Regression--Done
- Random number generation---Done
- Sampling---Done
- Descriptive statistics---Done
Project plan
- Developing a basic calc extension for data analysis--Done
- Determining the different analysis methods to be included in the tool --Done
- Getting familiar with each analysis method and collecting information about --Done
- How the data input should be given to the method
- Other external user given parameters required
- How the output should be displayed
- Developing each analysis method under the following steps -- Done
- User interface design considering the input and other parameters required
- Developing the functionality of the method
- Displaying the output of the analysis
- Integrating the developed method with the analysis tool ( extension)
Documentation
- Statistical data analysis tool documentation (updating the wiki etc.)--Done
- Code documentation--Done
Future Enhancements
- Addition of more useful analysis methods
- Input data from different sheets
- Translating extension to other languages
- Documenting all the analysis methods in detail with --In progress
- Introduction to analysis method
- How statistical analysis conducted in the analysis tool
- A description about the results of the analysis method
Tasks Completed
- The basic calc extension development has been completed together with the UI structure and the development structure of the extension
- The extension has been reviewed by my mentor and suggested necessary improvements
- Correlation analysis
- Covariance analysis
- Rank and percentile analysis
- T test
- Paired t test for means
- t test assuming equal variances
- t test assuming unequal variances
- ANOVA test
- One-way ANOVA
- Two-way ANOVA with replications
- Two-way ANOVA without replications
- F-test two-sample for variances
- Z test- Two samples for means
- Data validation and further testing of the methods already implemented
- First steps to the analysis methods with charting
- Moving average analysis with charts
- Histogram analysis with charts
- Exponential smoothing with charts
- Descriptive statistics analysis
- Sampling analysis
- Random number generation
- Regression
- UI enhancements
- Method enhancements
- Code documentation
- Wiki documentation
How statistical data analysis tool works
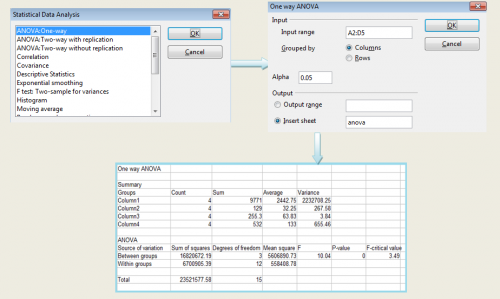
The figure shows the user interface structure of the statistical data analysis tool project.
Current tasks
Project has been completed
Project status
- The project is accepted for the OpenOffice summer internship program 2010
- The project is proceeding with adding new analysis methods
- The implementation of the data analysis tool project has been completed. The analysis tool has all the above mentioned analysis methods covering variety of statistical aspects.
